Blog post
Providing more transparency for your Performance Max campaigns

Performance Max (PMax) campaigns help you maximize your results with one AI-powered campaign across all Microsoft inventory. Advertisers using Microsoft Advertising’s PMax see an average 8% increase in incremental conversions. We observe even higher uplift as advertisers allocate more of their budgets to PMax to get the full benefits of cross-channel optimization.1
As advertisers continue to see better results with PMax, one theme remains consistent: you want more visibility into how results are delivered. PMax campaign reporting just got major upgrades, giving you deeper insights into what’s working. Here’s what’s new and best practices on how to make the most of it:
- Website URL (publisher) reporting with full performance metrics (now available)
- Landing page reporting for URL-level insights (now available)
- Search term reporting to understand customer intent (rolling out in May)
What’s new: See the placements driving results with additional performance metrics
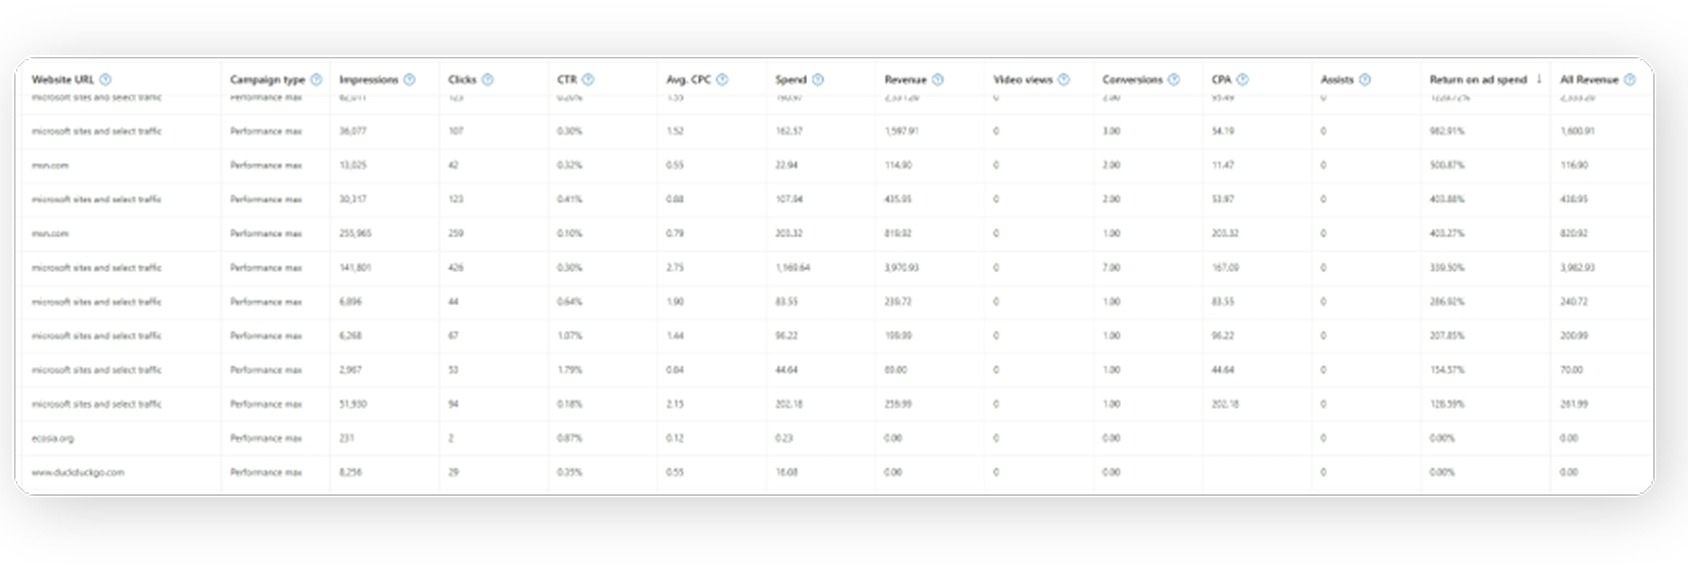
Most placement reports for cross-channel campaigns like PMax stop at impressions.
Our Website URL report is going further, with conversions, clicks and spend metrics now available. With more complete data than industry alternatives, it’s reporting that puts performance into full context. This makes it easier to see which placements are driving results and optimize PMax campaigns with greater confidence.
As you digest the new metrics available in the publisher report, here are some “dos and don’ts” to keep in mind:
Do: Use deeper insights to understand PMax results. It can sometimes be challenging to say yes to cross-channel solutions and AI-powered optimization. Share which websites are delivering strong conversion volume and ROI to highlight where AI is helping your business find new performance opportunities.
Do: Evaluate placements for brand suitability. If a placement seems wrong for your brand, you can exclude it at the account level via URL exclusion lists.
Do: Use sufficient conversion data to evaluate performance. Placement-level data reflects how the system is exploring and learning to drive conversions. Evaluate over a few weeks or conversion cycles instead of relying on short-term windows.
Don't: Over-optimize based on a single metric. Impressions without clicks doesn't always mean a channel is wasted. Some websites can build awareness earlier in the consumer journey and support conversions that occur elsewhere. Look at the full picture with conversion-driven metrics before acting.
When in doubt, let Performance Max optimize. Performance Max is designed to find the highest-ROI, efficient conversions across channels. Frequent manual exclusions can interfere with the platform’s ability to learn and optimize, and you may prematurely block a website that might deliver results down the road.
For more details on evaluating performance and making optimizations, see best practices for Performance Max.
In case you missed it: reporting on landing page URLs and search terms
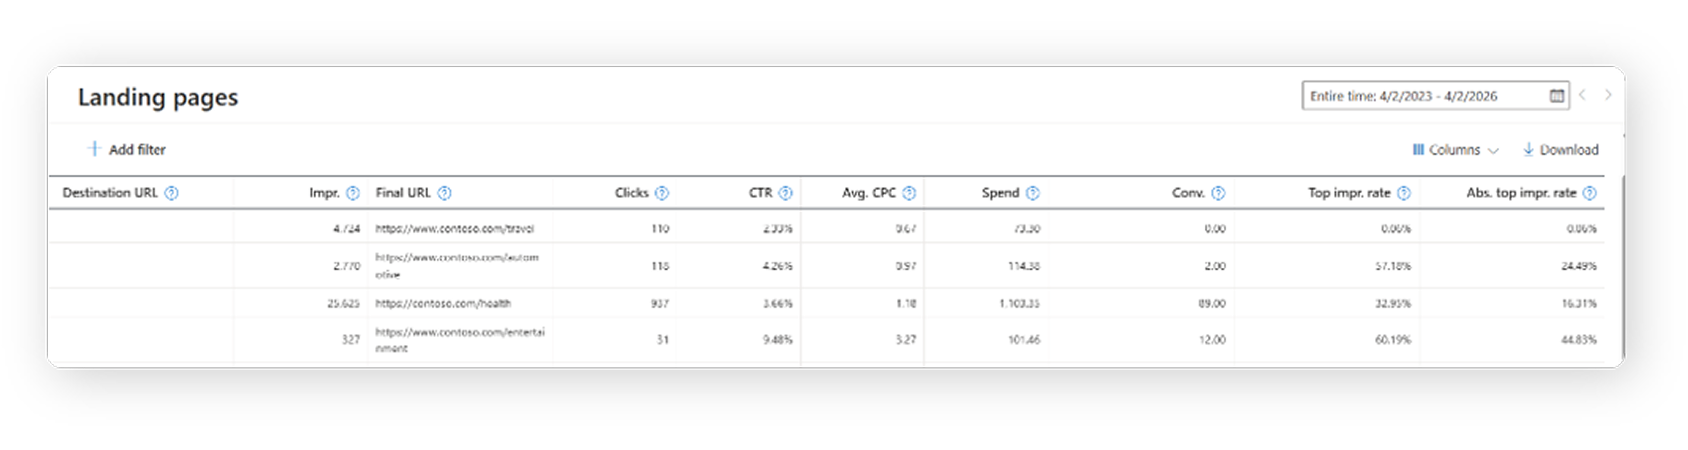
As shared in our April blog post, landing page reporting and search term reporting are also available for Performance Max. Landing page reporting helps you ensure that final URL expansion is routing your customers to relevant pages and providing the best user experience. If you identify mismatches, you can refine your setup using URL rules or custom labels to target specific pages on your website.
Search term reporting provides visibility into the queries driving traffic to your site. Use these insights to refine search themes and update creative assets—so your campaigns better align with what customers are actively looking for.
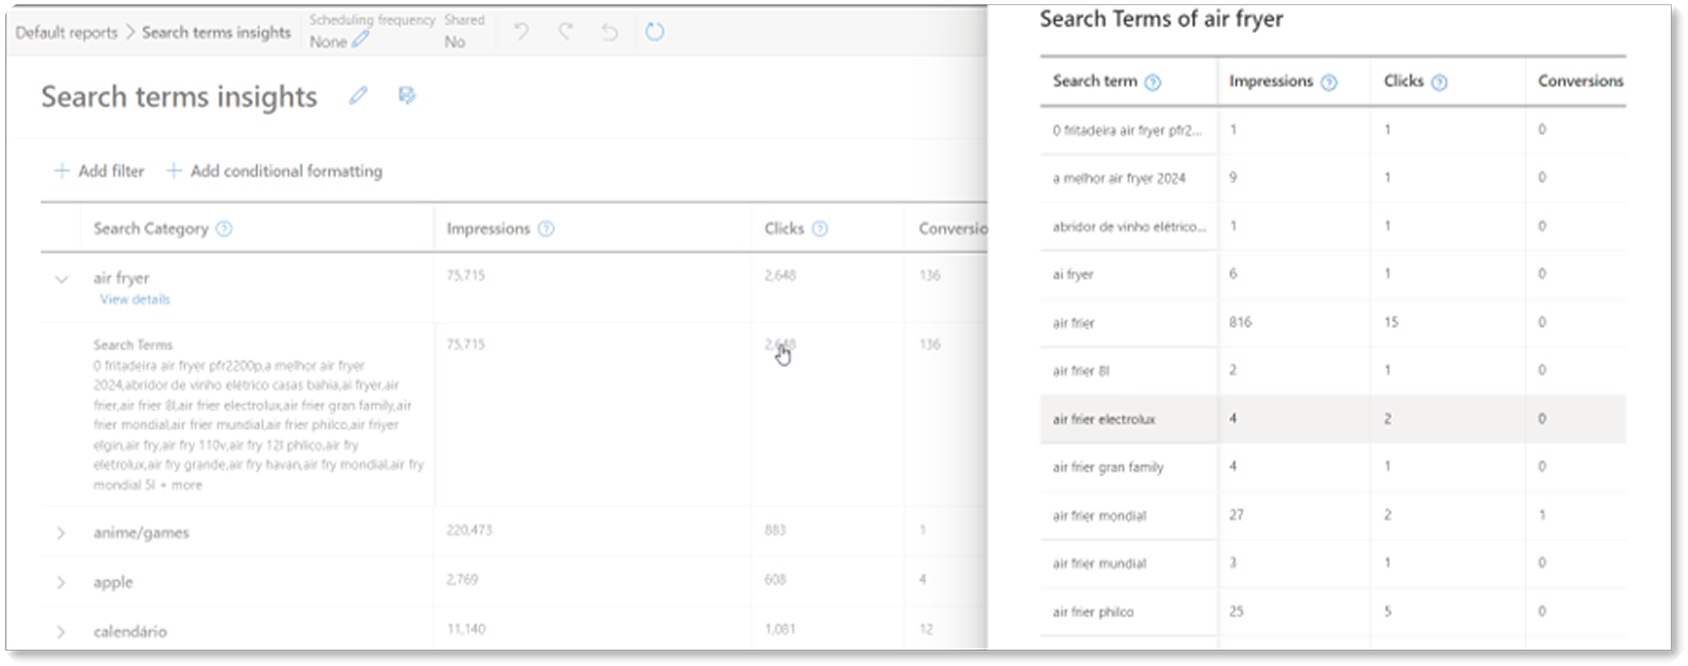
Learn more about getting visibility into queries via search terms insights (pictured above, available now) and search term reporting (rolling out for PMax in the coming weeks).
What’s next in transparency for PMax campaigns and Microsoft Advertising reporting
The momentum to provide you with more transparency in your PMax campaigns doesn’t stop here. Auction insights for PMax, coming soon, will build on existing impression share metrics by showing how your campaigns perform relative to competitors. You’ll be able to understand where you’re winning visibility, where competitors are outranking you, and how often you appear alongside them.
With metrics like overlap rate and outranking share, you’ll gain a clearer picture of the competitive landscape across your account—helping you make more informed decisions and unlock greater performance from your campaigns.
Last but not least, there’s more available for reporting in all Microsoft Advertising campaigns: custom columns now support all conversion metrics. This way you can create your own unique metrics based on the analysis that matters most to you. Learn more about creating custom columns here, and stay tuned for more exciting updates in our next Microsoft Advertising roundup later in May.
Help us keep improving your experience
Stay tuned for more upcoming updates, and in the meantime, your comments and feedback are integral to shaping and improving our product. You can use the Microsoft Advertising feedback portal, in-product feedback, X (Twitter), Instagram, or as always, contact Support.
[1] Microsoft internal data, Global, September 2024 – September 2025
Your input makes us better
Take our quick 3-minute survey and help us transform your website experience.