Blog post
Introducing Monetize Insights: A powerful analytics dashboard built to maximize monetization

Most publishers can agree that monitoring revenue performance and uncovering opportunities to maximize yield is often overwhelming. When you need data fast, sifting through granular reporting pulls is simply not an option. Problem solved—introducing Monetize Insights, a powerful analytics dashboard within Microsoft Monetize, powered by Xandr.
When you start using Monetize Insights, you can easily access the data you need. In one intuitive reporting dashboard, you’ll quickly see a holistic view of your monetization program. Access visual graphs that tell the full story. Set incisive filters to analyze insights, with comparison data to help refine strategy. See contextual bid rejection details. Present actionable, scannable details for busy stakeholders. Whether you’re a publisher or agency managing supply, key monetization health metrics and contextual tools to help you make more informed decisions are now at your fingertips.
“For publishers, user friendly data analytics can help identify issues sooner, diagnose issues faster, and ensure revenue is not left on the table. With Monetize Insights, publishers can easily monitor key monetization metrics and efficiently dive into the details of revenue drivers through intuitive ways to slice, compare, and visualize the underlying contributors,” said Christopher Walmsley, Senior Product Manager for Reporting and Analytics at Microsoft.
Monetize Insights—empowering you to do more with less
Monetize Insights delivers actionable data, helping you save time by removing the need to configure reporting dashboards or rely on in-depth reporting to access high-level revenue and inventory information. Read on to discover how the Total Revenue tab and Bid Rejection tabs can accelerate your success.
Accessible revenue insights
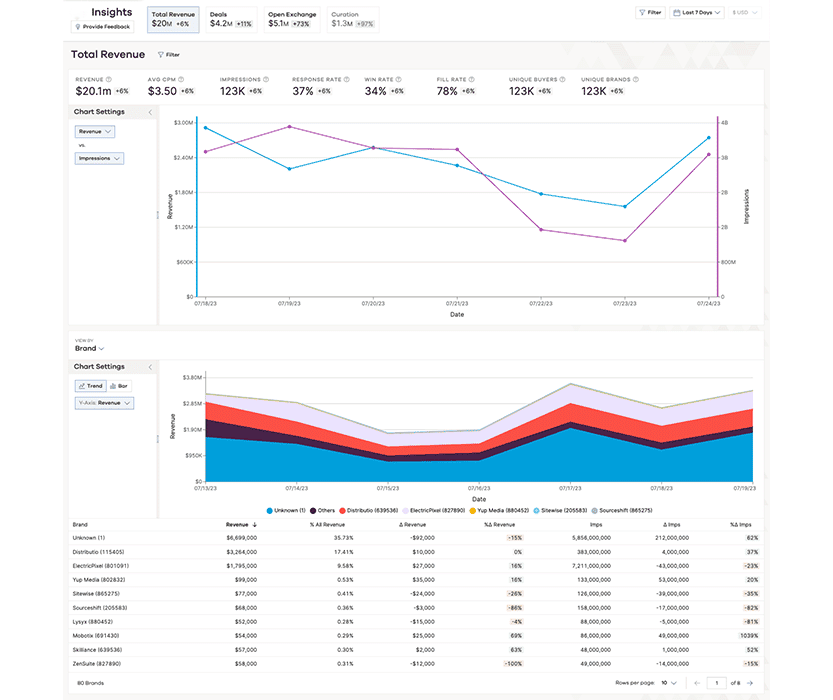
Now, with Monetize Insights, when checking inventory performance and key performance indicators (KPIs) including Impressions, Ad Requests, Fill Rate, Win Rates, and Revenue you only need to access one location: the Total Revenue tab.
The Total Revenue tab’s comparison charts illustrate trends and significant changes so you can quickly see how your revenue and other metrics are changing over time. This data becomes truly insightful when you start slicing the data across various reporting dimensions.
For example, filtering by Media Type property and Brand will allow you to see a detailed list of brands spending across your video inventory, how much they’re spending, how many impressions they’re buying, and at what cost per mille (CPM).
“The Total Revenue tab has been indispensable in simplifying how we track and dissect our business performance, revealing trends across channels, buyers, and brands with ease. For us, it's become an essential dashboard that saves time and enhances our strategic analysis, proving invaluable in our day-to-day operations.”
- Benjamin Christie, Founder and President at Gourmet Ads
Understand the revenue impact of your inventory settings
The Bid Rejection tabs give you powerful information. When you use Bid Rejection tabs you gain access to valuable information on revenue impacting blocks, helping you understand how your inventory settings affect your bottom line. By making bid rejection values clear, you can easily identify opportunities to make new adjustments that unblock revenue or validate past decisions.
The Bid Rejection tabs include data across Ad Quality, Deals, Demand Issues, and Floor Rules. Each view shows you key, specific insights:
- Ad Quality—revenue-impacting blocks to help identify and evaluate opportunities to adjust ad quality (blocking) settings.
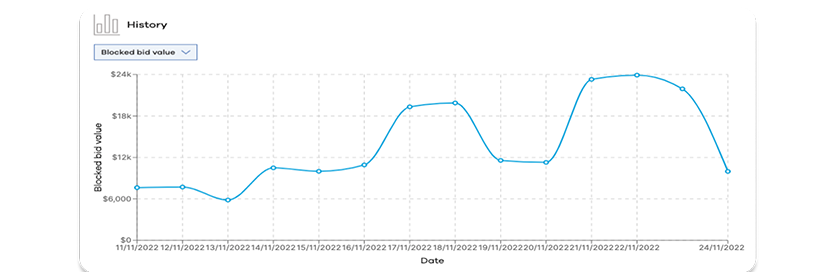
- Floors—average blocked bid price that price floors are causing for each Publisher in your Monetize seat.
- Deals—the most significant bid rejections by deal on one screen with the percentage change in the Summary tab.
- Demand Issues—issues caused by buyer behavior such as native asset mismatch, missing creative ID, or if video duration is too long.
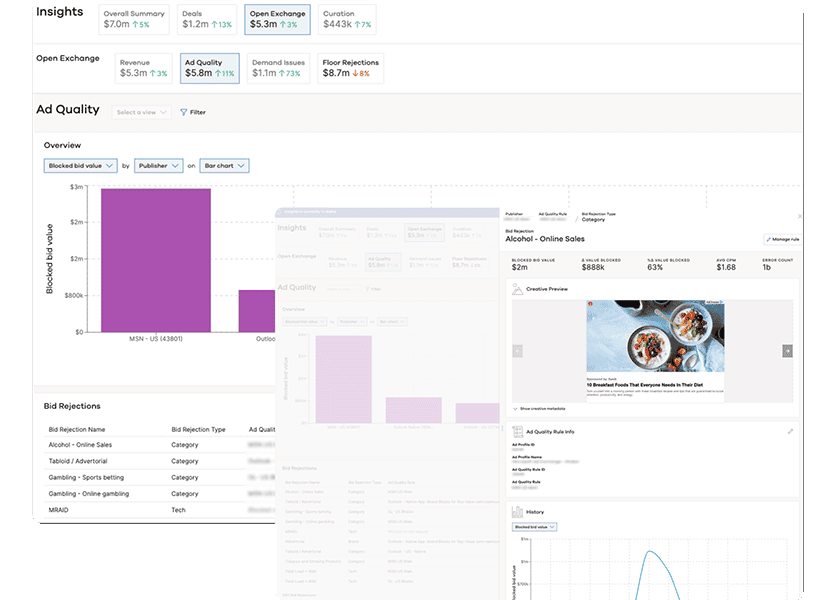
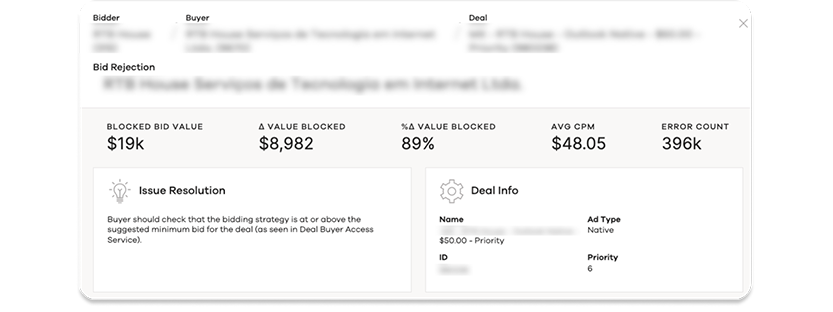
The Bid Rejection tabs also provide contextual information on a rejection to show the cause and when it started. Where relevant, you’ll be able to preview up to five blocked creatives directly within the side panel review them, and even download them if needed.
Here’s an example of insights you can get from the Bid Rejection tabs.
Let’s say you’re a lifestyle publisher blocking an entire category like Home and Garden. You’re doing this because you’re trying to grow your affiliate commence business and need to protect the contractual agreements you have. Because you’re a lifestyle brand, your vision is to see more programmatic revenue come in from this category, but the thinking is—it’s too risky to unblock the category because it’s unclear which buyers are engaging.
Monetize Insights will give you visibility into the value of a blocked category and the buyers comprising the category, giving you the data, transparency, and peace of mind to make an informed decision on whether you want to unblock.
“Monetize Insights is informative and intuitive. The bid rejection data had helped us identify bid rejection types that were costing us revenue and that we could quickly reverse. The comparison charts on the Total Revenue tab have also been helpful, bringing to light some interesting trends. Overall, the dashboards have been easy to use and quite insightful!”
- Barbara Jennings, VP of Media Operations at Underdog Media
A streamlined design to help you save time
Gone are the days of configuring reporting dashboards or relying on in-depth reporting pulls to access high-level inventory information. Now, with Monetize Insights, you can leverage multiple views and tools to get things done.
A guided flow helps you navigate quickly, so you can easily find the insights you need—from KPI and revenue filters that provide a quick snapshot into your business’ health, including Revenue, CPM, Impressions, Response Rate, Win Rate, Fill Rate, Unique Buyers, and Unique Brands to implementing configurable metrics that align with your monitoring needs.
From trend comparison charts that let you compare specific times or alternate metrics, such as Impressions and Revenue to drill down panels, summary tables, and sort features—our vision is to empower you to do more with Monetize Insights.
Ready to get started?
Monetize Insights is now available globally. Begin using our new and powerful analytics dashboard and see your data come to life.
If you’re currently using Monetize, sign into your account to activate Monetize Insights.
And if you want to find out more, contact Xandr at Microsoft Advertising.
Your input makes us better
Take our quick 3-minute survey and help us transform your website experience.